Index / Case 03 / Centive
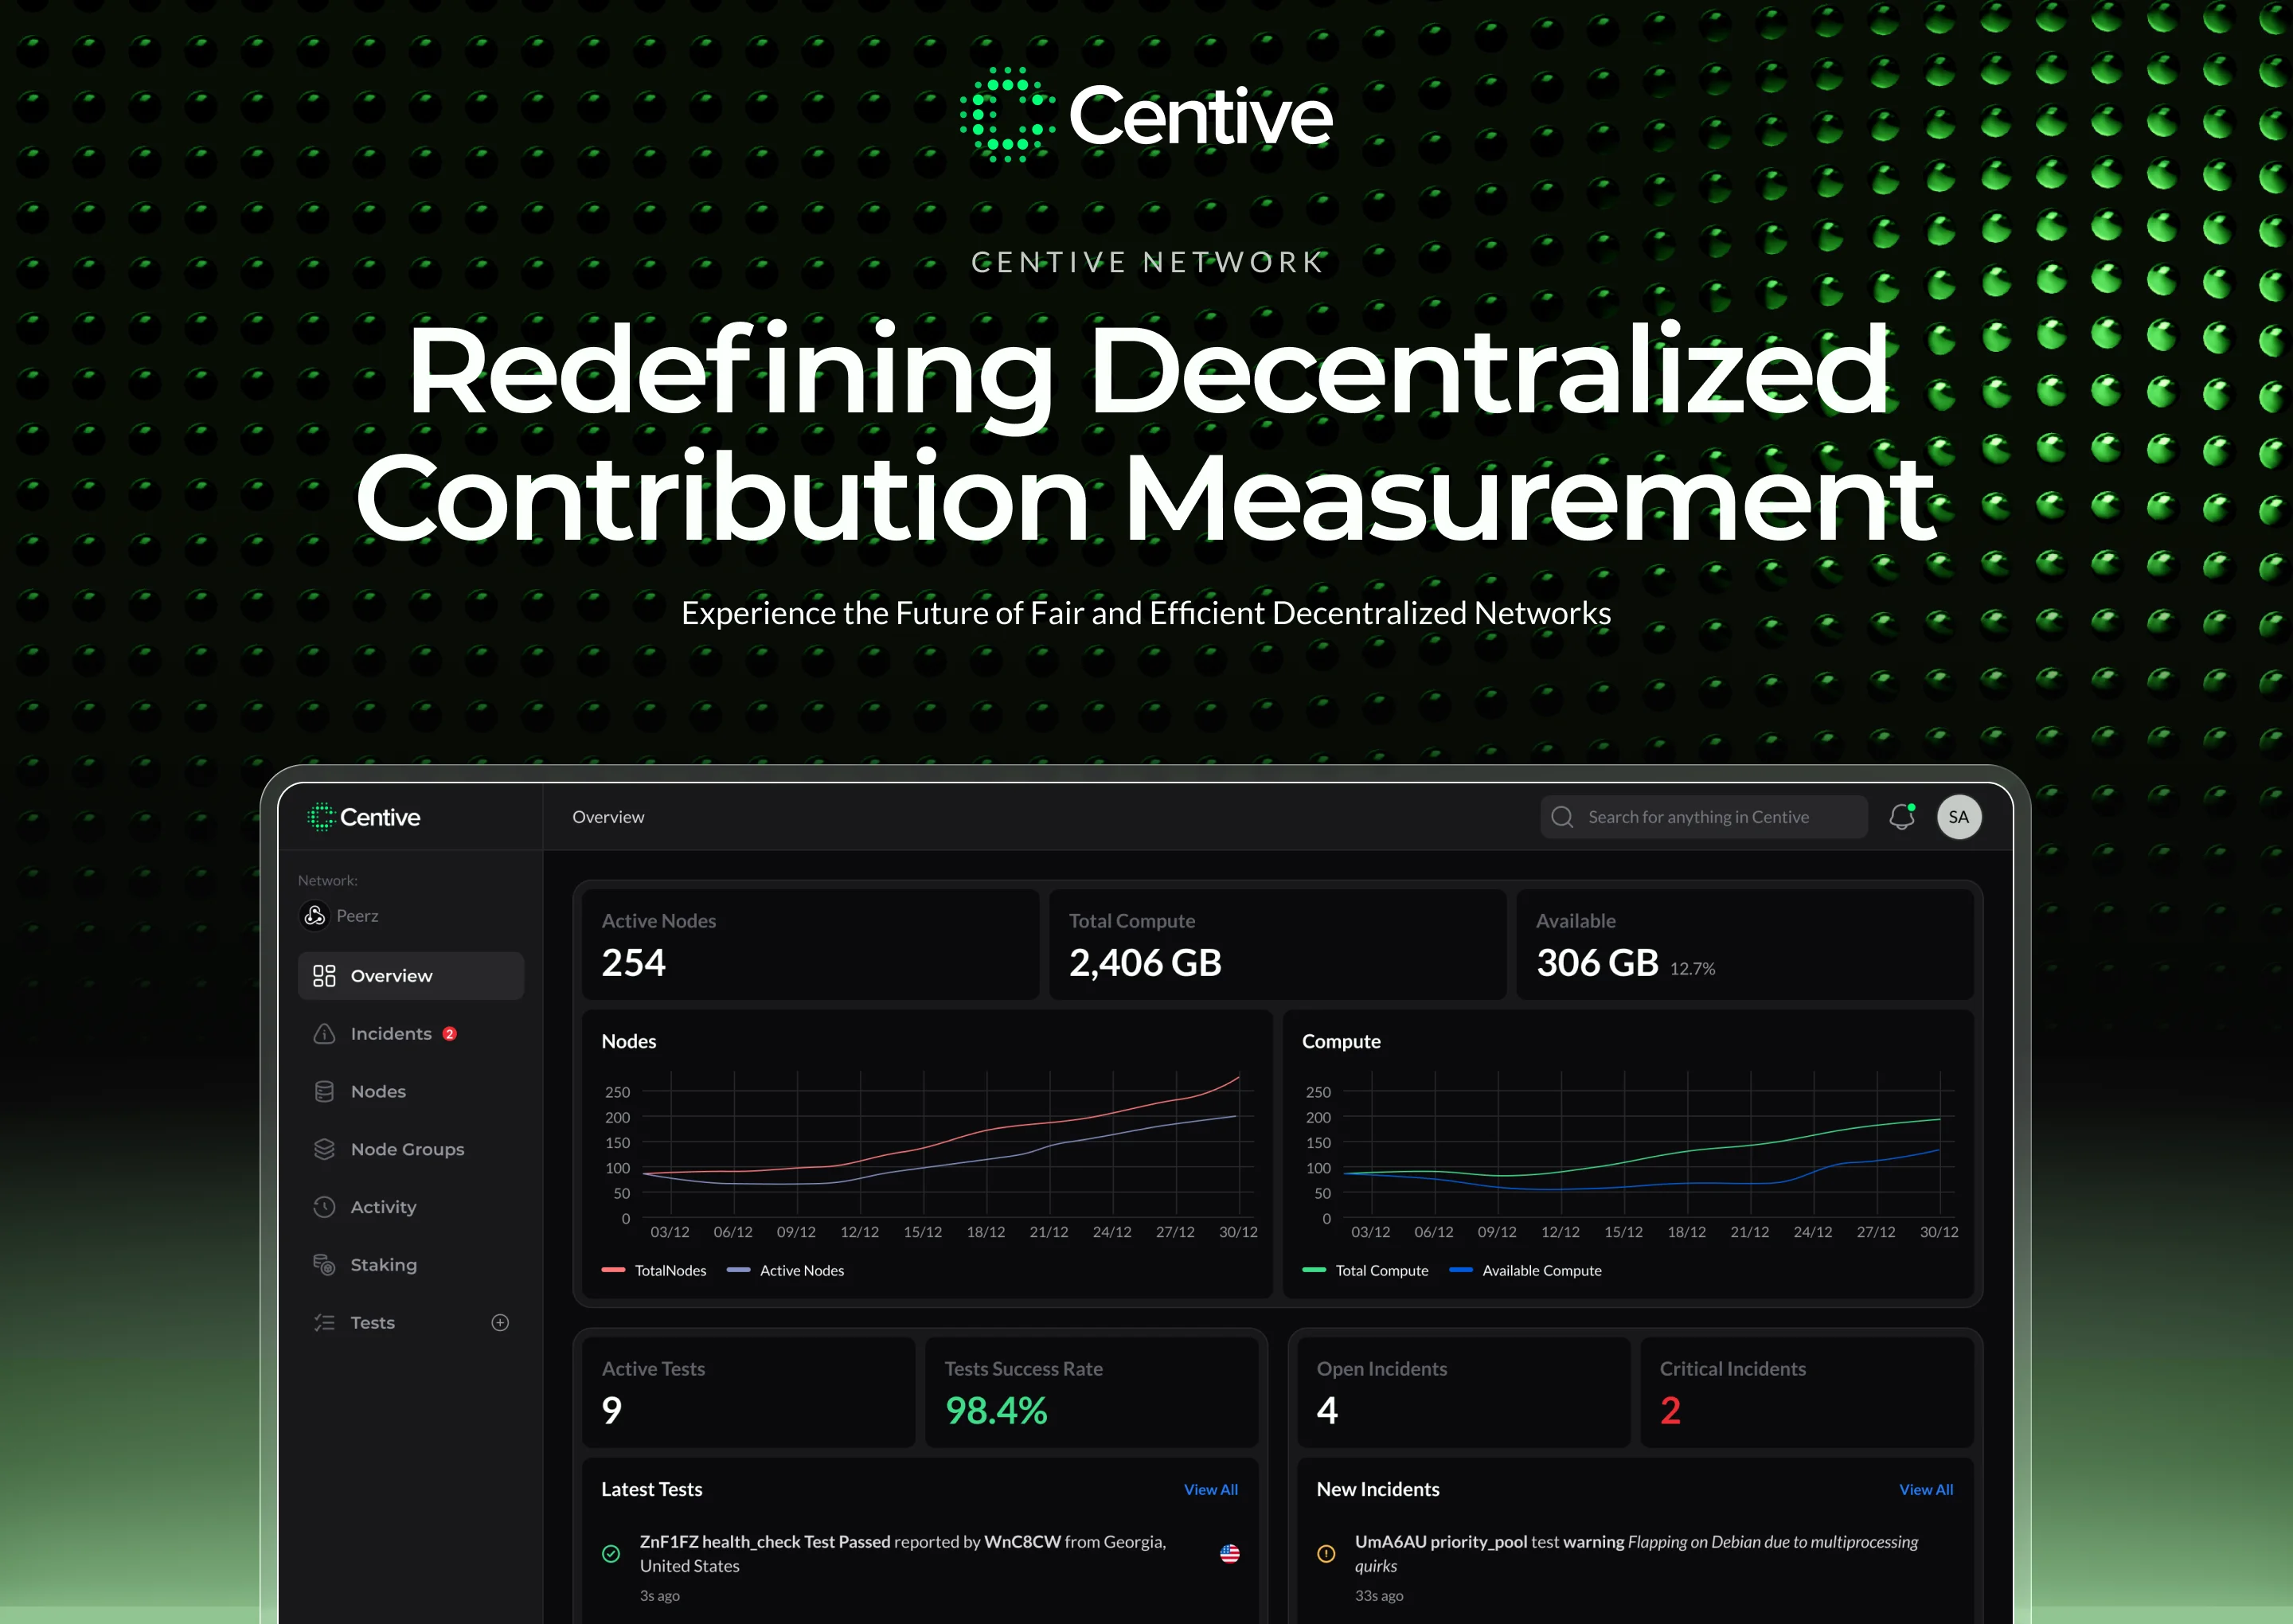
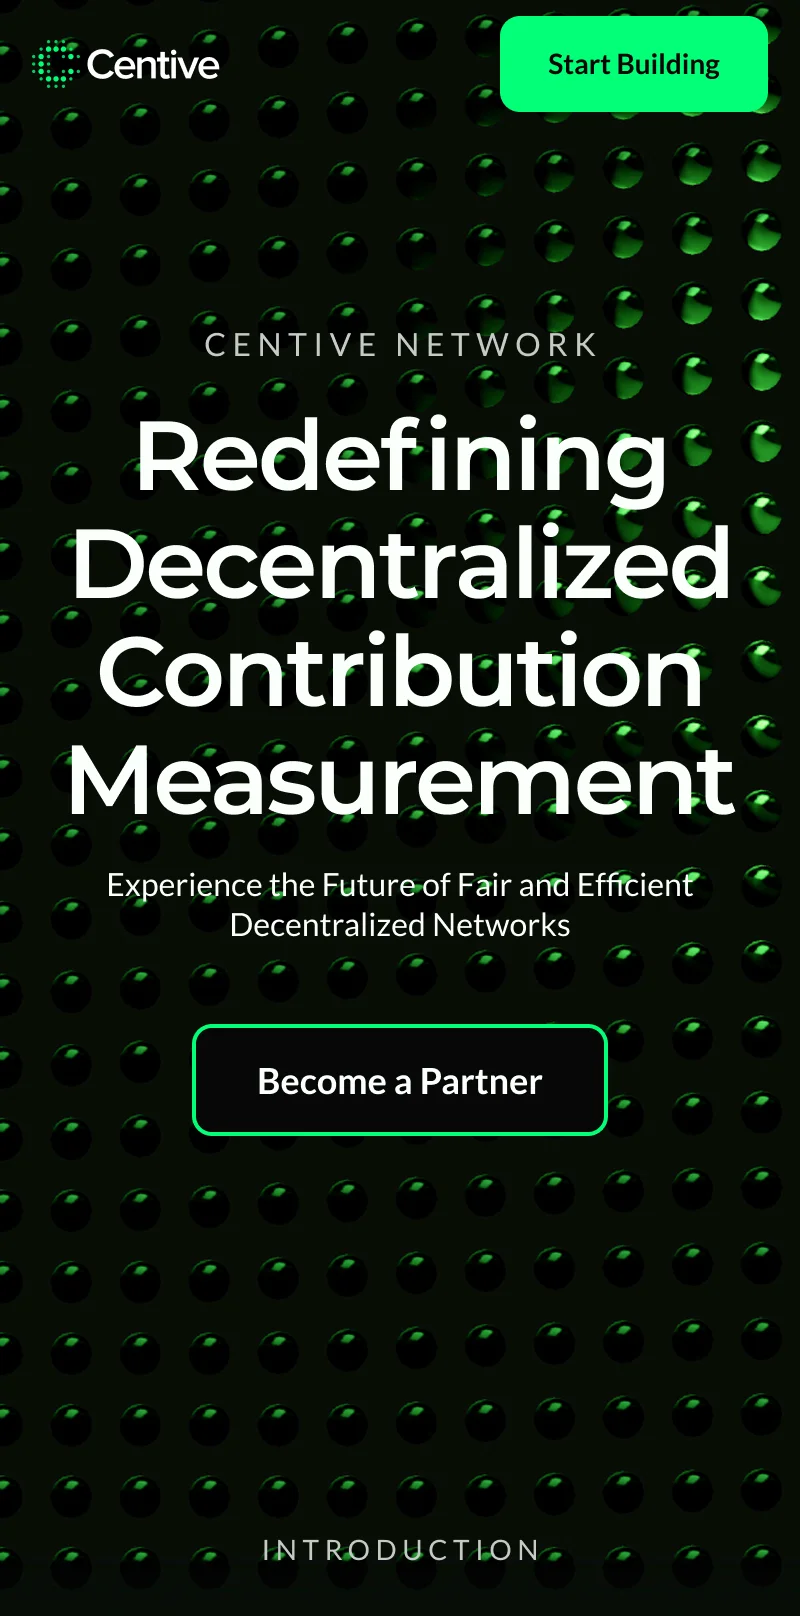
Brand, website, and product for a DePIN network.
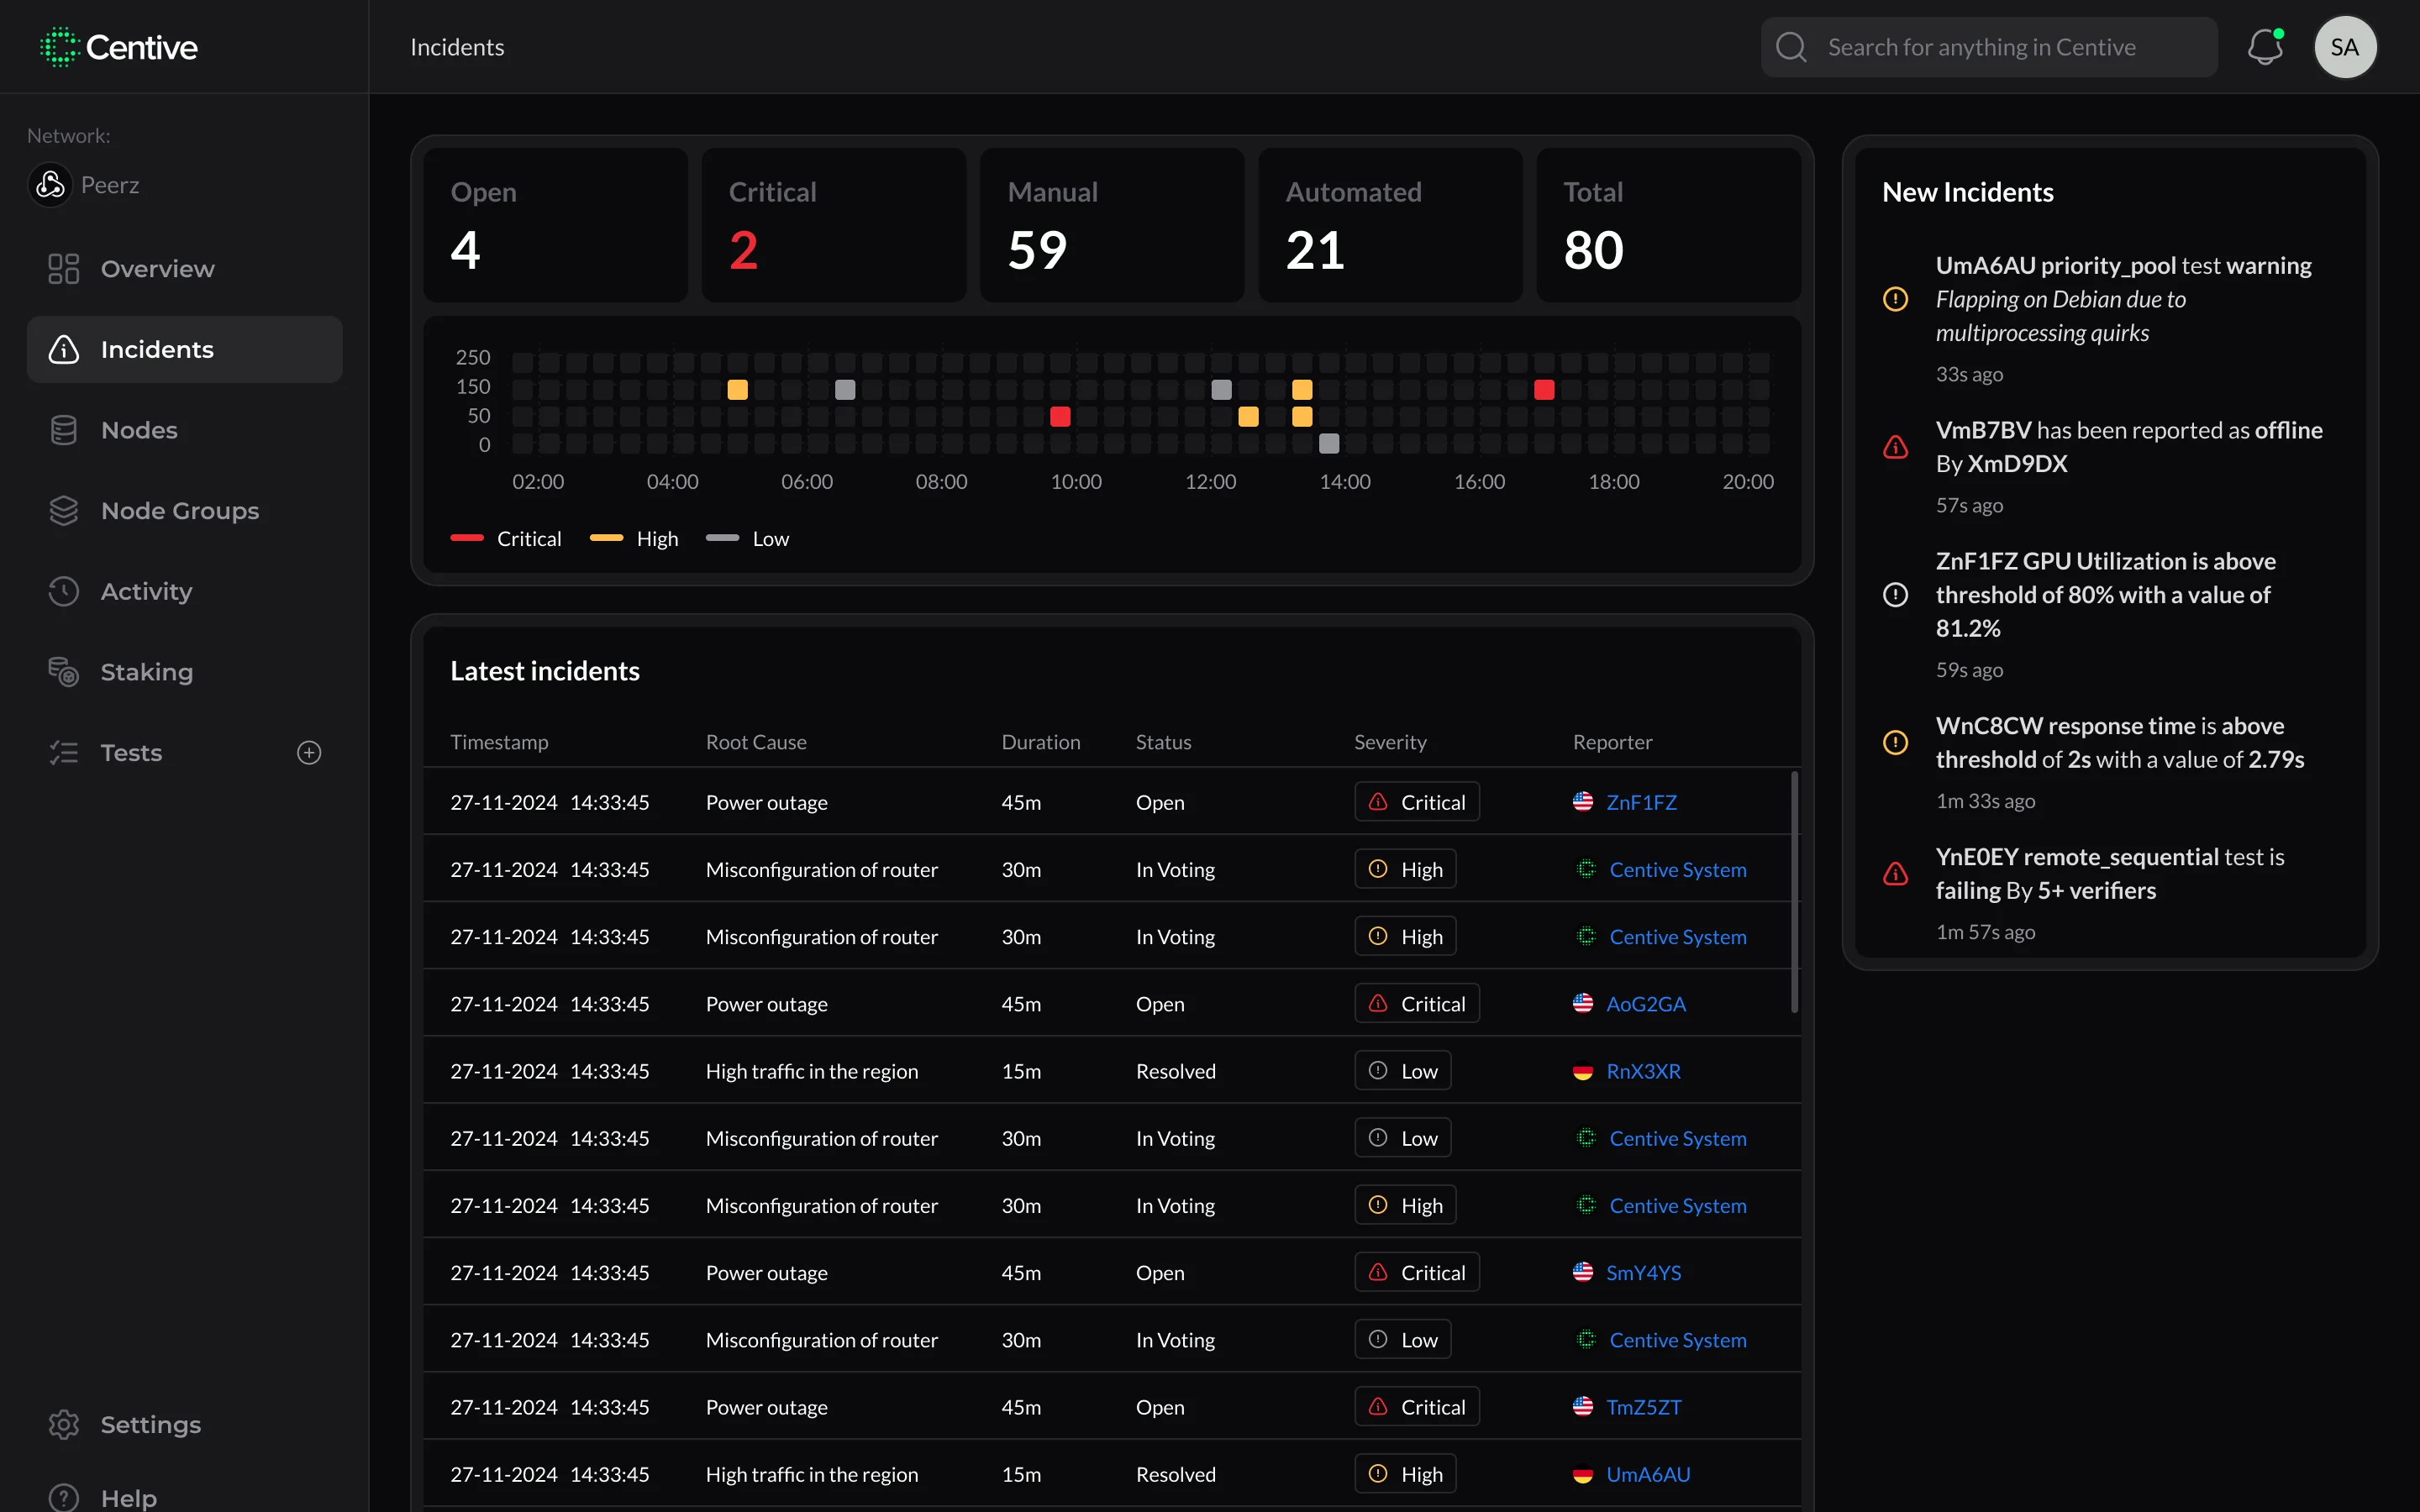
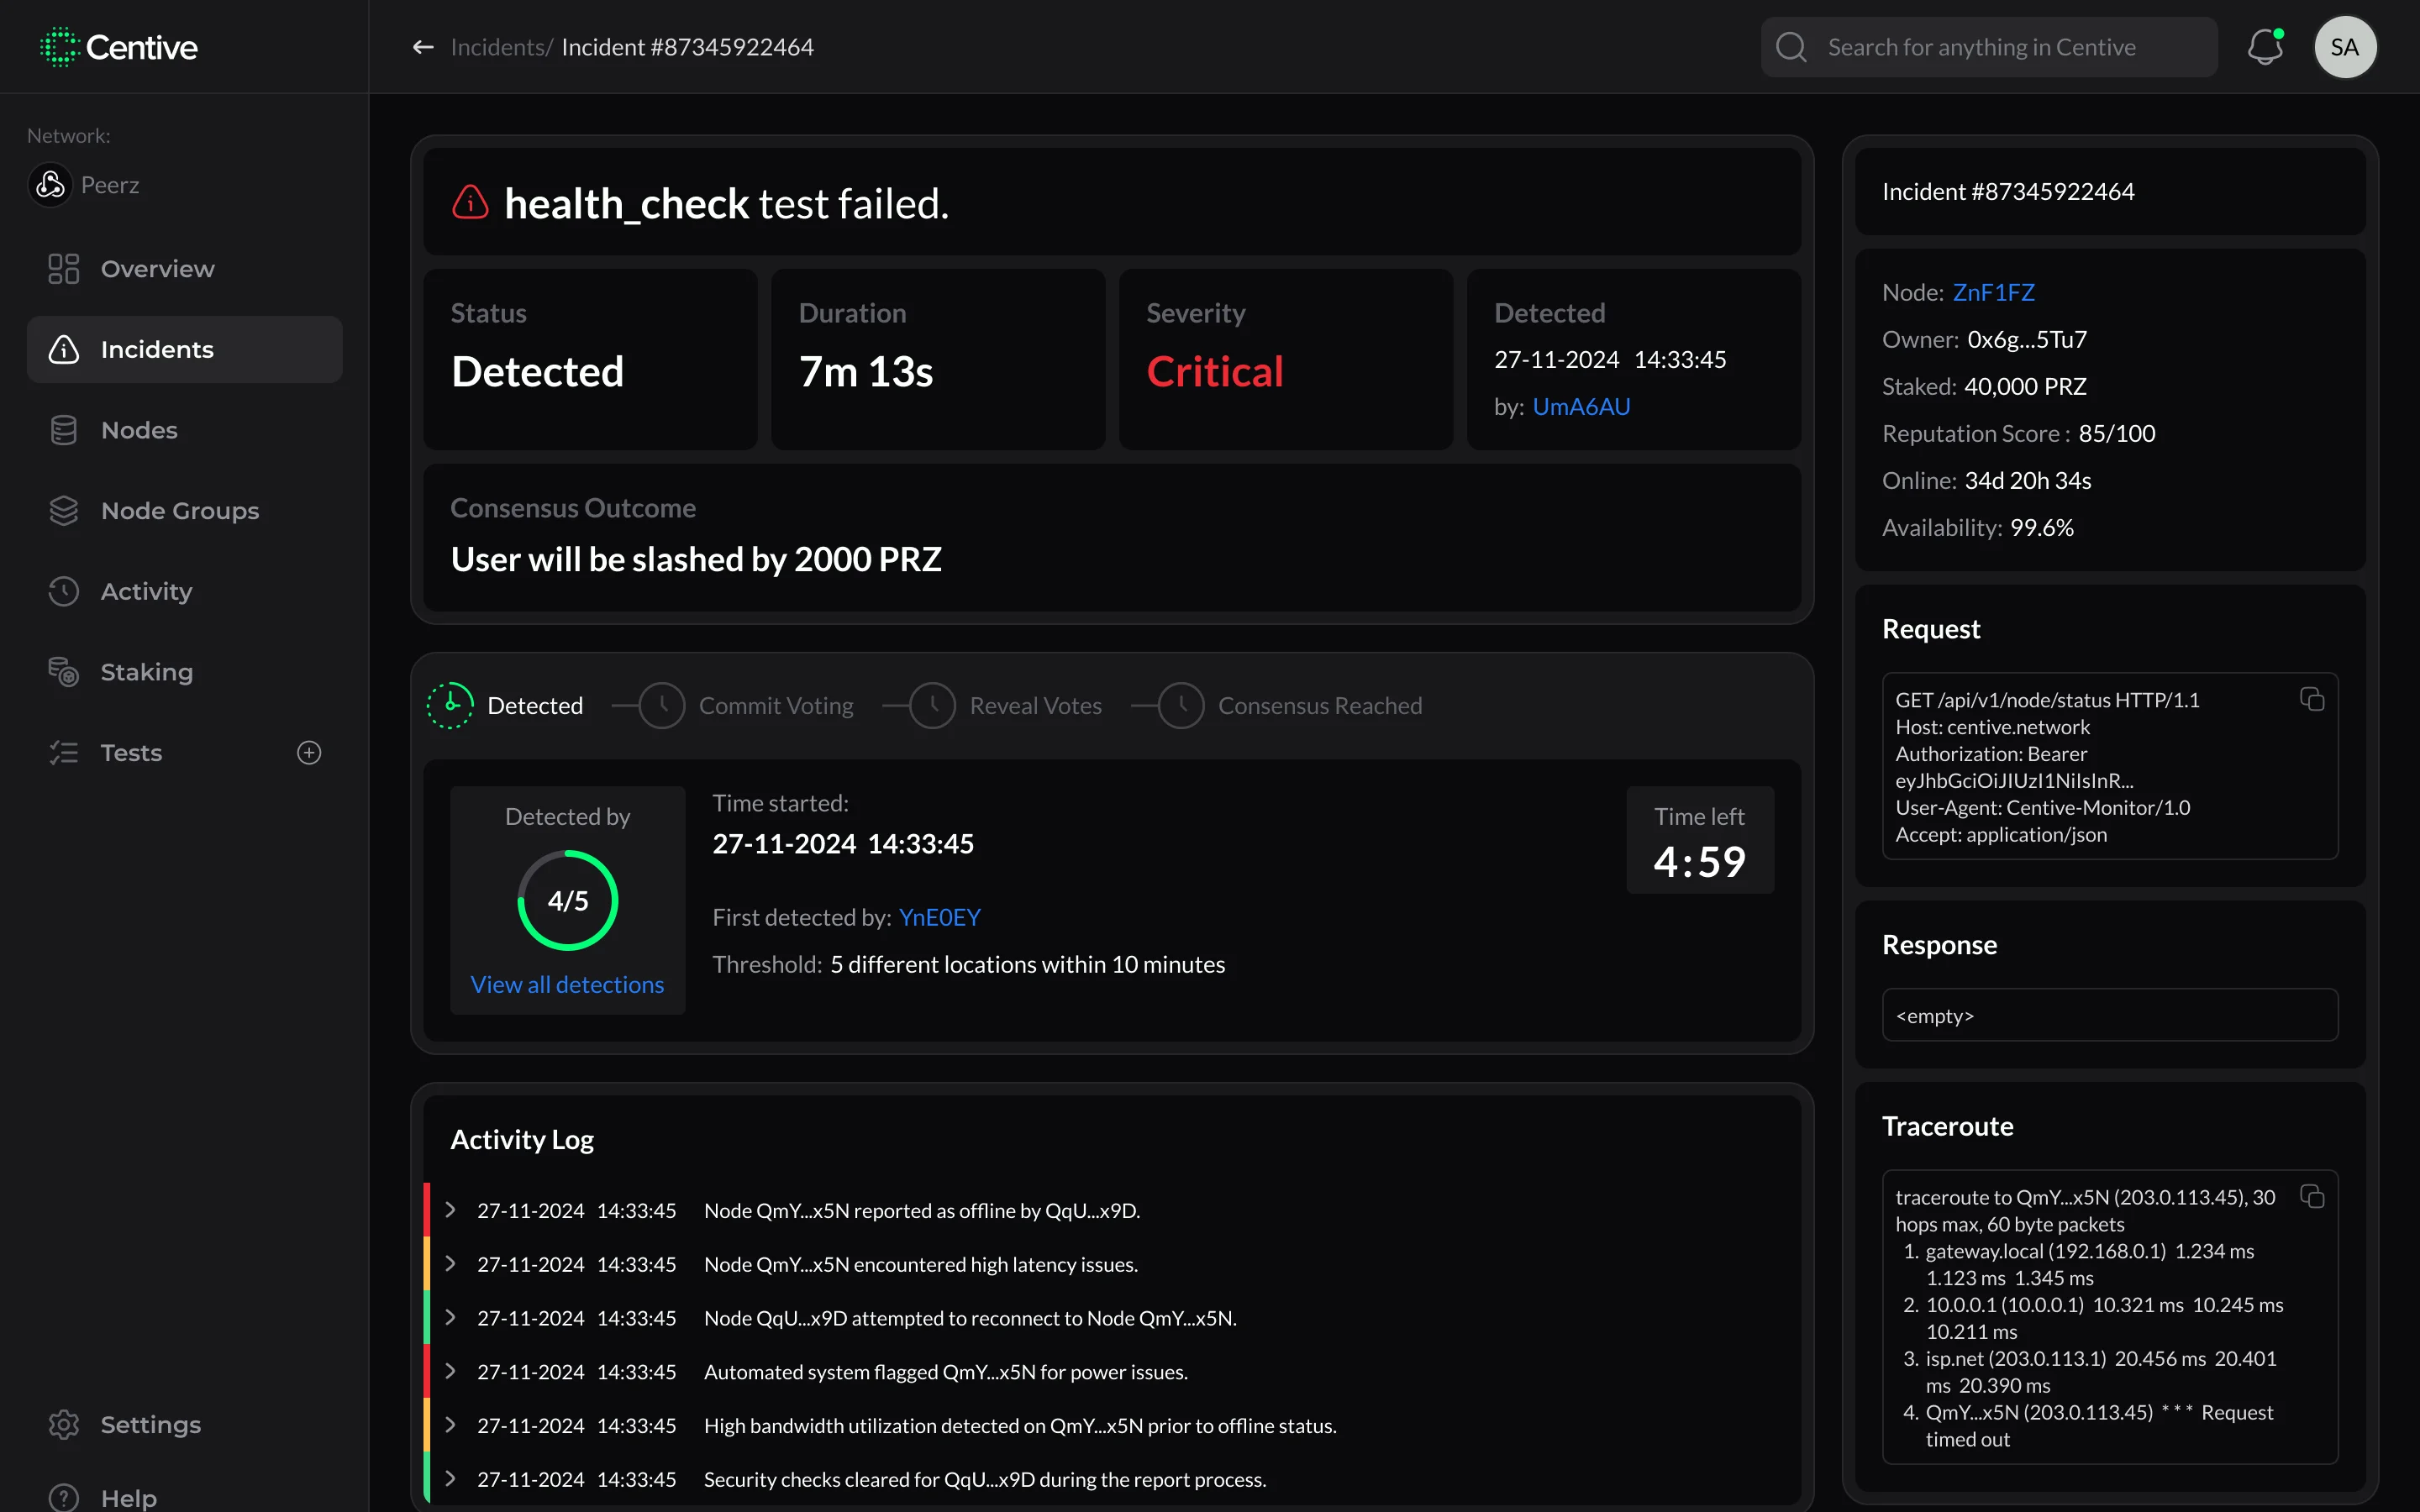
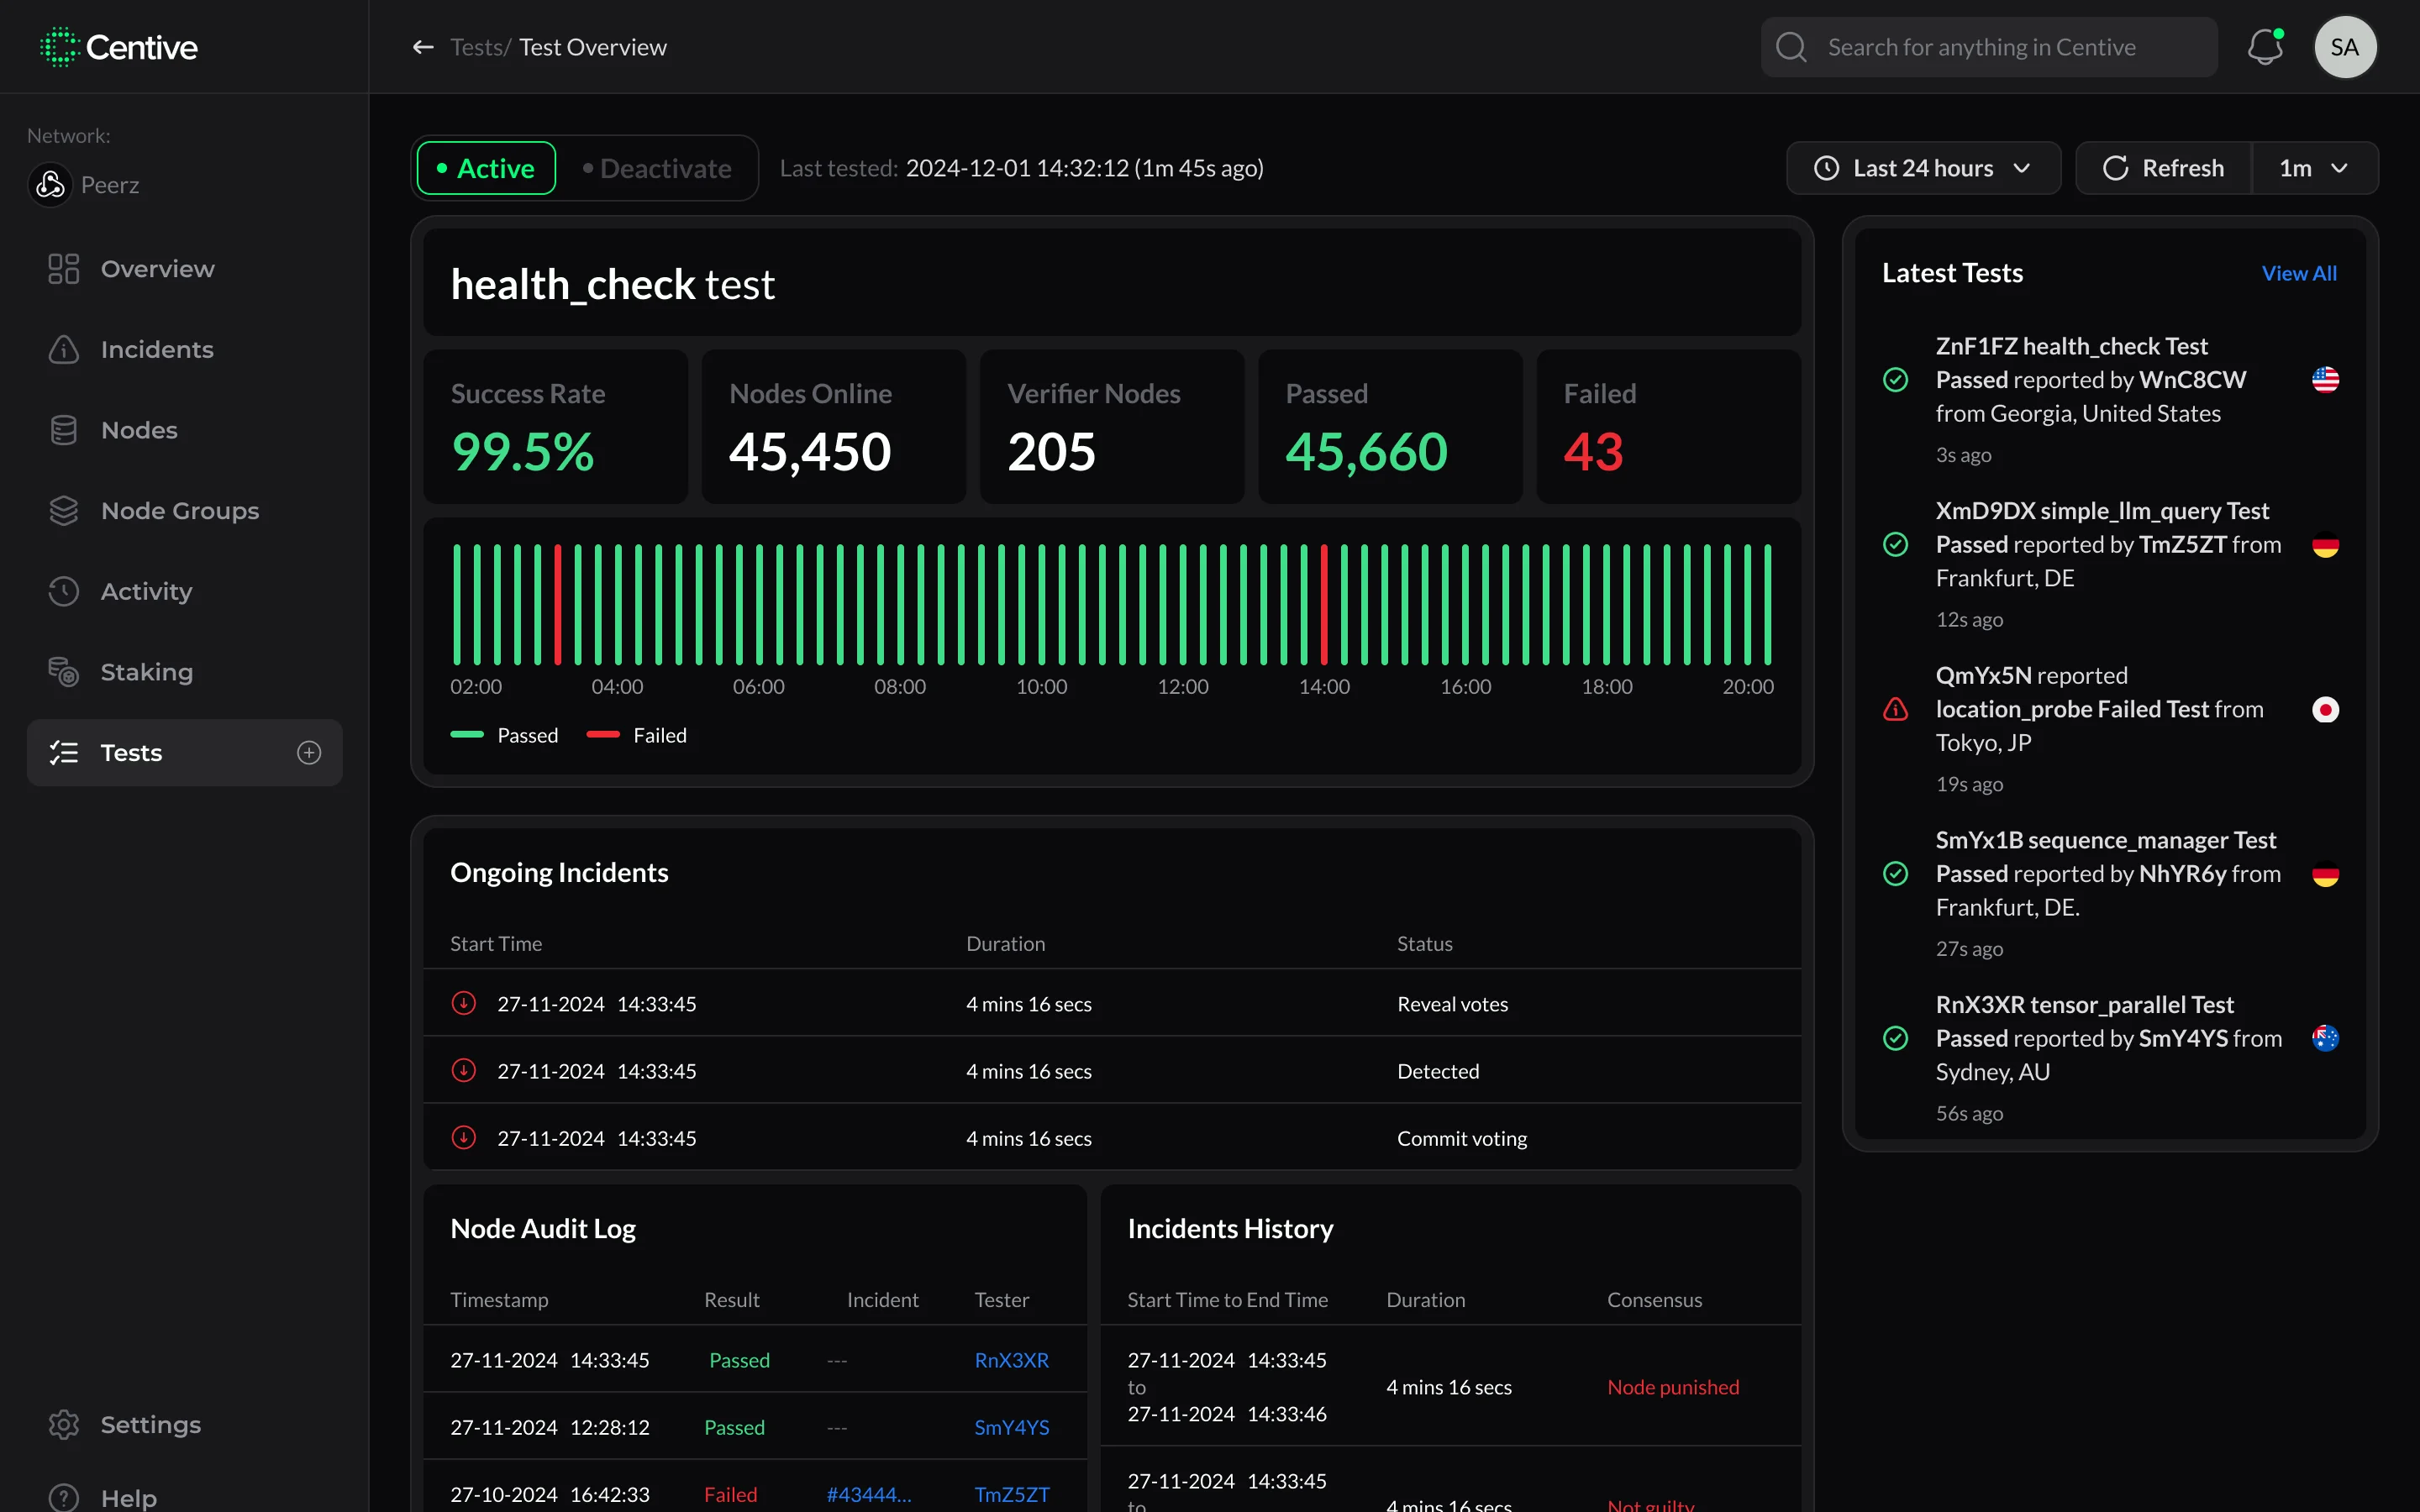
Centive is the monitoring and verification layer for distributed compute. I owned the full design scope: brand identity, marketing website, and operator dashboard, all from zero. 0→1, solo, across 12+ product screens.